
2026 Stock Picks: 10 Fundamentally Strong Large-Caps (Top Pick Inside)
- Sanzhi Kobzhan

- Dec 15, 2025
- 8 min read
Updated: Feb 11

If you’re building a 2026 watchlist, fundamentals are a great filter: they help you find companies with durable cash generation, strong profitability, and clear operating momentum—the kind of setup that can earn its way into higher prices.
In this article, I’m sharing 10 large-cap stocks that stand out on fundamentals, using a simple framework:
Valuation + profitability + growth context
Plus recent earnings highlights (and where relevant, management outlook) to support the 2026 thesis.
All the data was pulled from the Stocks2Buy Fundamental Explorer web app (handy for extracting ratios, peer comparisons, and fundamental dashboards fast).
At the end, I’ll name the single best stock in this list for 2026 based on fundamentals.
2026 Stock Picks
1) Amazon (AMZN) — High-Margin Engines Powering the
2026 Setup
Why it’s on my 2026 ideas list
Amazon’s latest results show the core growth engines (especially cloud) are still accelerating—exactly what you want heading into a new investment year.
Fundamental Snapshot
Recent Earnings Momentum
Q3 2025 net sales rose 13% YoY to $180.17 B, driven by 20% growth in AWS sales.
Net income jumped to $21.2 B (vs $15.3 B prior year).
Free cash flow / cash generation: operating cash flow up 36% YoY.

Profitability
Amazon’s ROE (~24%) means it earns about $0.24 of net profit for every $1 of shareholders’ equity; compared with the U.S. “Retail (General)” average ROE of ~25%, that’s roughly in line / slightly lower (still strong).
Its operating margin (~10–11%) is operating income ÷ sales, so Amazon is keeping roughly $10–$11 of operating profit per $100 of revenue—about double the Retail (General) operating margin of ~5%, which is very good vs the sector.
Its gross margin (~50%) is gross profit ÷ sales (what’s left after direct costs/COGS), and that’s far above the Retail (General) gross margin of ~32%, indicating a much more profitable revenue mix than a typical retailer.
Valuation
Trailing P/E ~32× (below sector avg ~75×).

2) Visa (V) — The “Quality Compounder” Built for 2026
Why it’s on my 2026 ideas list
Visa is the classic fundamentals play: high margins, strong ROE, dependable growth, and huge cash conversion—traits that tend to travel well across market cycles.
Fundamental Snapshot
Recent Earnings Momentum
Q4 2025 payments volume climbed 9% YoY.
Revenue rose 12% to $10.72 B.
Adjusted EPS was $2.98 (vs $2.71 a year ago).
Guidance points to ~11% revenue growth for FY2026.

Profitability
ROE is profit generated per $1 of shareholder equity, and ~52% is excellent—well above the Financial Svcs (Non-bank & Insurance) ~31.6% average.
Operating margin is operating profit per $1 of revenue, and ~66% is extraordinary versus the sector’s ~16.3%; gross margin (~80%) is also higher than the sector’s ~68.4%.
Valuation
Trailing P/E ~34× vs sector ~28×; forward P/E ≈25×.

3) Disney (DIS) — Improving Margins + Streaming Progress = 2026 Optionality
Why it’s on my 2026 ideas list
Disney’s story improves when earnings quality improves—and the recent numbers show that directionally: parks strength, margin improvement, and streaming moving the right way.
Fundamental Snapshot
Recent Earnings Momentum
In the quarter cited in this snapshot, adjusted EPS was $1.11 (est 1.05).
Domestic park operating profit rose ~22% (parks strength remains a key pillar).
Revenue referenced here: $22.46 B ( +3.4% YoY).

Profitability
An ~11.7% ROE is solid, and it’s far better than the Entertainment industry average ROE
An operating margin of ~15.5% is good versus Entertainment’s average ~8.3%, suggesting improved operating profitability versus typical peers.
Gross margin ~37.8% is about in line/slightly below the Entertainment average ~39.7%
Valuation (Stocks2Buy fundamentals)
P/E ~16× (below sector ~31×), with DCF models (≈$51).
4) Exxon Mobil (XOM) — Cash Returns + Production Strength Into 2026
Why it’s on my 2026 ideas list
Exxon’s 2026 appeal is simple: scale + cash returns + advantaged production growth.
Fundamental Snapshot
Recent Earnings Momentum
Q3 2025 adjusted profit was $8.1 B ($1.88/share better than estimates).
Production hit a record ~4.8 M boepd.
Free cash flow dipped to $6.3 B (from $11.3 B prior) due to heavy capex.
Capital returns: $4.2 B dividends + $5.1 B buybacks (quarter).
Longer-range ambition: targeting $25 B incremental earnings by 2030.

Profitability / Valuation
ROE ~11.4% is a bit below the Oil/Gas (Integrated) average ROE of ~14.2%, so returns look okay but not standout vs sector.
A P/E ~17× is much higher than the industry’s ~9.1× in the same dataset (i.e., priced richer than the integrated-oil peer set).
EV/FCF of ~19× means the business generates about ~5.9% FCF yield on enterprise value (1/19), and a ~4% dividend yield is roughly in the neighborhood of the sector’s typical yield in the dataset.

5) Citigroup (C) — Cheap Valuation, But 2026 Depends on Returns Improving
Why it’s on my 2026 ideas list
This is a “turnaround fundamentals” idea: earnings beats and revenue strength are encouraging, but Citi needs sustained ROE improvement for a true 2026 rerate.
Fundamental Snapshot
Recent Earnings Momentum
Q3 2025 banking revenues were $2.1 B, up 34%.
Adjusted EPS was $2.24 (above consensus $1.90).

Profitability
ROE is the headline “profitability vs equity” measure, and ~6.9% is weak for a money-center bank (Money Center banks average ~11.5% ROE).
ROTCE (return on tangible common equity) is a stricter version that strips out goodwill/intangibles; ~8.6% “still lagging” usually implies the bank is not earning a strong return on its core tangible capital base.
That combination typically reads as below-sector profitability, which is often why large banks can trade at discounted valuation multiples
Valuation
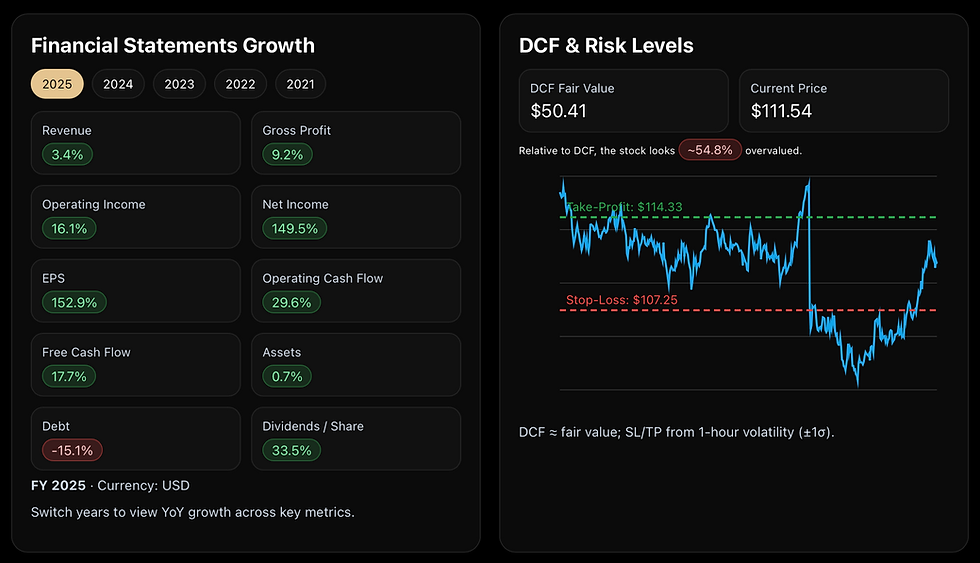
P/E ~15.9× vs Financial Services avg ~28×; DCF fair ~$125 vs stock ~$113.

Citigroup P/E valuation. Extracted with the Stocks2Buy Fundamentals Explorer 
Citigroup DCF based price target and Stop-Loss & Take-Profit. Extracted with the Stocks2Buy Fundamentals Explorer
6) ASML (ASML) — Elite Moat + AI Investment Cycle (With a 2026 Speed Bump)
Why it’s on my 2026 ideas list
ASML’s fundamentals are exceptional—but the 2026 narrative includes a near-term pause as China demand normalizes.
Fundamental Snapshot
Recent Earnings Momentum
Q3 2025 net bookings were €5.40 B.
Net income was €2.12 B.
Outlook referenced here: expects flat sales in 2026 as China demand cools.
Profitability / Valuation
ROE ~52% is extremely strong versus the Semiconductor Equipment industry average ROE of ~31.8%.
Operating margin ~66% is also massively above the industry’s average operating margin of ~24.1%—that’s a “best-in-class” profitability profile.
A P/E ~38× is actually below the Semiconductor Equip industry average ~43.6× (and also below the total-market ex-financials “current P/E” ~59.8), so the valuation looks less stretched than many peers despite the margins.

7) AMD (AMD) — Big Growth Tailwinds, Fundamentals Must Catch Up
Why it’s on my 2026 ideas list
AMD’s AI + data center momentum is real. For 2026, the question is whether growth keeps converting into sustained profitability at the pace the valuation implies.
Fundamental Snapshot
Recent Earnings Momentum
Q3 2025 revenue was $9.25 B (beat $8.76 estimates ).
Data center sales jumped 22% to $4.30 B.
Client (PC) revenue rose 46% to $2.80 B.
Adjusted EPS $1.20 beat forecasts.
Management optimism: 35% annual growth overall and $20 in EPS by 2030; AI chip market to $100 B by 2030.

Profitability / Valuation
ROE ~5–6% is well below the Semiconductor industry average ROE of ~19.1%, so current returns on equity look weak vs sector.
A trailing P/E ~111× is far above the Semiconductor industry’s ~64× “current P/E,” the stock is priced for high growth / improving profitability.
An FCF yield ~1.6% means free cash flow is small relative to price today (i.e., investors are paying up for expected future cash flows), so execution matters a lot.

8) American Electric Power (AEP) — Regulated Stability + A Real 2026 Demand Catalyst
Why it’s on my 2026 ideas list
Utilities rarely feel “exciting,” but AEP’s data-center-driven capex cycle is a tangible growth lever heading into 2026.
Fundamental Snapshot
Recent Earnings Momentum
Raised capital plan from $54B to $72B over 5 years.
Q3 revenue grew ~11% to $6.01 B.
Adjusted EPS was $1.80 (inline with $1.81 est).
Long-term EPS growth target ~7–9%.

Profitability / Valuation (Stocks2Buy fundamentals)
DCF fair ~$107.85 (close to $114 market). Consensus Price target 112.29 (almost fairly valued)
ROE ~12.8% is a bit above the Utility (General) average ROE of ~10.8%, which is generally good for a regulated utility.
A P/E ~16.7× is below Damodaran’s Utility (General) average ~19.2×, and also below an estimated S&P 500 Utilities P/E ~21.7 as of Dec 15, 2025, suggesting cheaper-than-sector pricing on earnings.

9) General Dynamics (GD) — Defense + Gulfstream Strength With “Reasonable” Valuation
Why it’s on my 2026 ideas list
GD combines strong execution with large end-markets (defense + business jets). That’s a solid 2026 backdrop.
Fundamental Snapshot
Recent Earnings Momentum
Q3 2025 revenue rose 12.9% YoY to $12.91 B.
Adjusted EPS was $3.88 (vs est $3.70).
Gulfstream deliveries surged: 39 jets vs 28 prior year.
Operating margin guidance referenced here: ~10.3%.
Profitability / Valuation
ROE ~18.3% looks strong versus the Aerospace/Defense industry average ROE of ~11.9%.
ROIC measures after-tax operating profit generated per $1 of invested capital; ~10.9% is typically read as healthy capital efficiency (especially in mature industrials).
A P/E ~21.9× is below the Aerospace/Defense industry “current P/E” ~39.2×, while an FCF yield ~5.2% indicates a more meaningful cash generation rate relative to price than many growth names.

10) Tyler Technologies (TYL) — Sticky Government SaaS (Great Business, Rich Price)
Why it’s on my 2026 ideas list
Tyler’s fundamentals (recurring revenue + steady growth) are strong—but it’s priced like a premium compounder, so 2026 upside depends on continued execution.
Fundamental Snapshot
Recent Earnings Momentum
Q3 2025 revenue was $595.88 M (up 9.5% YoY).
EPS was $2.97 vs $2.86 estimates.
Subscription (SaaS) revenue grew ~19.9%.
Raised the low end of revenue guidance (as cited in this snapshot).

Profitability / Valuation
DCF Price Target $327.43 vs stock ~$458 (~28% overvalued) .
Subscription revenue 68% of total; operating margin cited ~20%
A P/E ~62× is high in absolute terms, but it’s far below the Software (System & Application) industry’s very elevated average current P/E ~179.8×
My #1 Top Pick for 2026 (Based on Fundamentals): Visa (V)
Out of these 10, Visa (V) is the cleanest “fundamentals-first” 2026 idea:
Profitability is elite: operating margin ~66%, gross margin ~80%, ROE ~52.5%
Growth is steady and broad-based: payments volume +9% YoY and revenue +11.3% YOY with $10.72 B in Q4 2025.
Earnings power is reliable: adjusted EPS $2.98 in Q4 2025.
2026 outlook remains constructive, with FY2026 pointing to low-double-digit revenue growth.


Comments