
Best Stocks for Beginners: Value, Growth, and Income Stocks Explained
- Sanzhi Kobzhan

- Jul 20, 2025
- 10 min read
Updated: Mar 23

Table of contents:
Investing in stocks can feel overwhelming for beginners, but understanding a few basic categories makes it much easier. Most stocks can be grouped into three main types – value stocks, growth stocks, and income stocks – each with different characteristics and ideal times to invest. In this guide, we’ll break down these stock types in simple terms, explain when in the economic cycle each tends to perform best, and show how you can identify them.
We’ll also introduce an easy tool – the Stocks 2 Buy iOS app – that helps you instantly see a stock’s type and key metrics like fundamentals, growth potential, and dividends. By the end, you’ll know how to pick stocks for your portfolio with more confidence and start investing like a pro.
How to Pick Stocks for Your Portfolio
When building your portfolio, it’s important to pick stocks that match your investment goals. Are you looking for bargains with solid fundamentals? Companies that could skyrocket in the future? Or steady earners that pay you cash dividends? Knowing the stock type can help you decide. Below are the three main stock types – value, growth, and income – and what makes each one unique:
Value Stocks: These are stocks of companies with strong fundamentals (healthy balance sheets, steady profits) that are trading below their intrinsic fair value. In other words, the market has overlooked or undervalued them, so their price is cheap relative to what the business is worth. Value stocks often have a low price-to-earnings (P/E) or price-to-book ratio, signaling a potential bargain.
They tend to be mature, established businesses (sometimes former high-fliers that fell out of favor) and often pay dividends. Value investors buy these stocks hoping the rest of the market will eventually recognize the company’s true worth, causing the price to rise. When to buy: Value stocks typically shine during bear markets or recessions – tough times when many stocks are down – because that’s when you can scoop them up at a discount. They also often perform well in the early stages of economic recovery (when the economy starts growing again) as investors rotate into undervalued names.
Growth Stocks: These are shares in companies expected to grow earnings and revenue at an above-average rate. Growth companies usually reinvest their profits back into the business rather than pay dividends, fueling even faster expansion. Think of popular tech innovators or any company with a new product or service that’s rapidly gaining market share. Because of their high potential, growth stocks often trade at higher valuations (like high P/E ratios) – investors are willing to pay more today in hopes of big capital gains. However, they also come with higher risk and volatility; if the company’s growth slows or falls short of expectations, the stock price can drop sharply.
When to buy: Growth stocks tend to excel during bull markets and economic expansions – when the economy is strong, interest rates are low, and investors are optimistic. In booming market conditions, these high-fliers often outperform as people chase future growth. Early in a bull market (or when interest rates are falling), growth stocks can run up rapidly. Just be cautious if the economic cycle turns or rates rise – growth stocks can stumble in late-cycle or recessionary environments when investors become more risk-averse.
Income Stocks: These stocks provide regular income to shareholders in the form of dividends. An income stock is typically a stable, low-volatility company that consistently earns profits and shares them with investors as cash payouts. Examples include many utilities, telecoms, real estate investment trusts (REITs), and consumer staples – businesses that may not grow fast, but reliably generate cash. Dividend yield is a key metric for income stocks – it tells you what percentage of the stock price is paid out in dividends each year. Income stocks usually have above-average dividend yields (often higher than bank interest rates or bond yields) and modest stock price growth.
They’re popular for retirees or anyone seeking steady cash flow. When to buy: Income stocks can be great to own during uncertain or down markets. In fact, high-dividend stocks often hold up better in bear markets, as investors cling to them for steady income. The dividends provide a buffer: even if the share price dips, you still get paid, which can soften losses in a downturn. Income stocks are also attractive when interest rates are low (because dividends provide income you can’t get from cash savings) or anytime you want to add stability to your portfolio.
As a beginner, you don’t have to choose only one type – a balanced portfolio might include all three. For example, you might buy some value stocks for long-term growth and safety, a few growth stocks for high upside, and some income stocks for dividend earnings. Understanding these categories helps you set expectations for each investment. If you buy a growth stock, you know to expect more price swings and no dividends, whereas a dividend stock might not shoot up in price but will pay you regularly.
The economic cycle also plays a role: you might lean into value and income stocks if you suspect a recession is near (seeking bargains and stability), or tilt toward growth stocks when the economy is booming. The key is to pick stocks that fit your strategy and the market environment.
Easy Stock Analysis for New Investors
Researching stocks might sound complicated – digging through financial statements, running valuation models, calculating ratios – but thankfully, there are tools that make stock analysis easy for beginners. One handy tool is the Stocks 2 Buy app for iOS. This app simplifies the process by instantly telling you what type a stock is (value, growth, or income) and even suggesting the best time to buy it based on market conditions. It also provides a few key metrics so you can quickly gauge a company’s fundamentals, growth potential, dividend income, and recent performance without being a finance expert.
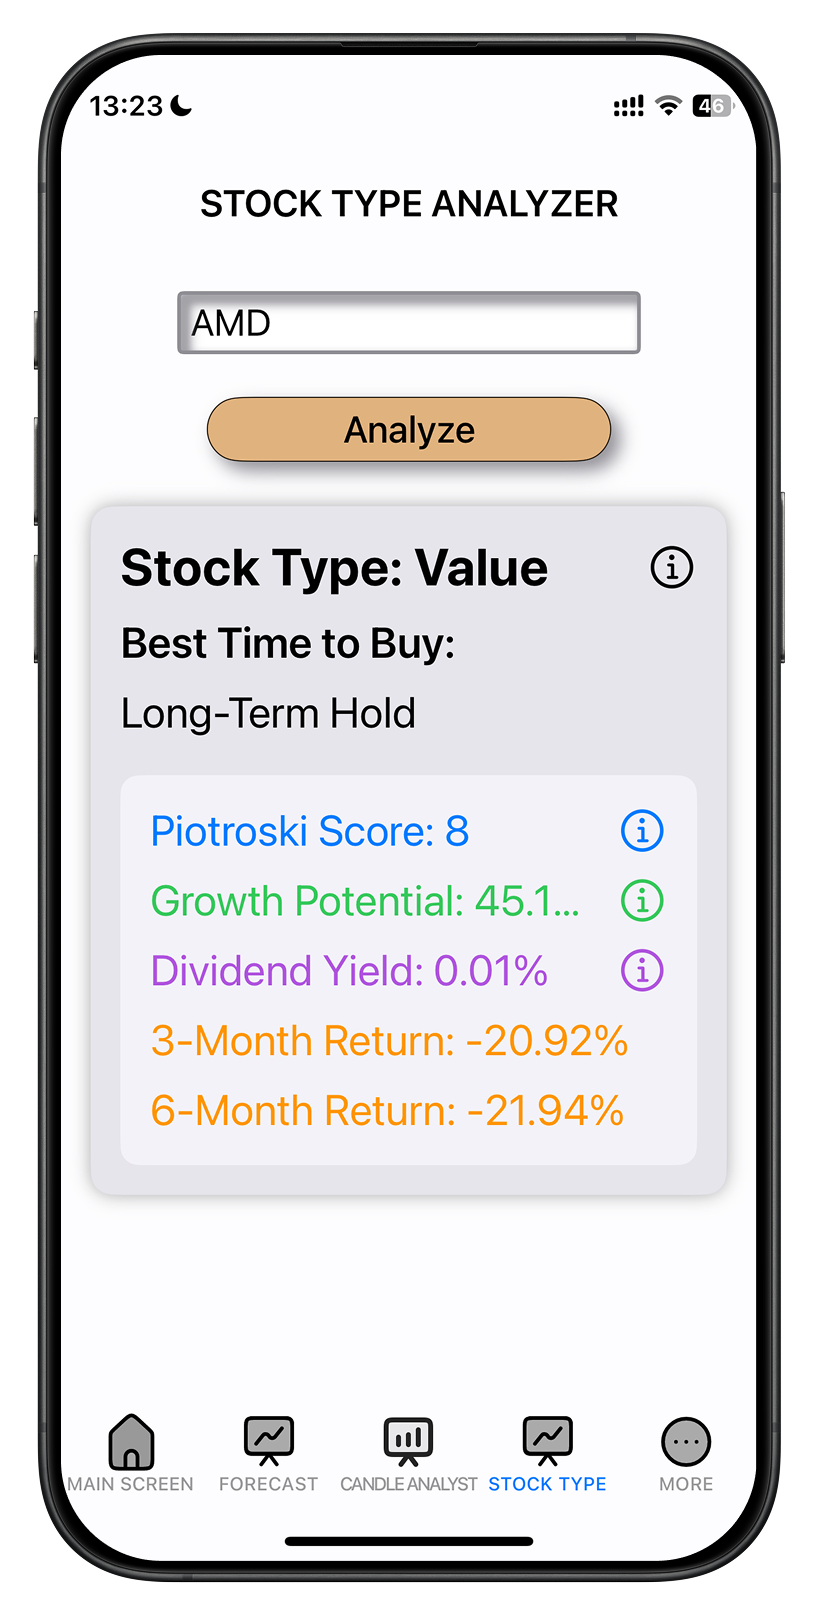
For example, the app’s Stock Type screen for Advanced Micro Devices (AMD) is shown below. In the screenshot, the app classifies AMD as a Value stock and indicates the “Best Time to Buy” is as a Long-Term Hold (meaning it’s a stock you’d buy and patiently hold for the long run rather than expecting a quick win).
The app also displays AMD’s Piotroski Score of 8 (out of 9, reflecting very strong financial health), a Growth Potential of 45.1% (an upside estimate based on a DCF valuation model), a Dividend Yield of 0.01% (virtually no dividend, which is typical for a growth-oriented tech stock), and AMD’s recent 3-month and 6-month returns (–20.92% and –21.94%, showing the stock’s price has pulled back in the short term).
Now let’s break down those metrics and why they’re useful:
Stock Type & Best Time to Buy: The app prominently tells you whether a stock is classified as value, growth, or income, and when it’s typically best to buy. This insight comes from how each type performs in different market cycles. For instance, if a stock is tagged as Value, the app might remind you it’s ideal for long-term holding or buying during downturns (as it did with AMD).
A Growth stock might come with a note that it excels in bull markets (so the best time to buy could be during an economic expansion or when interest rates are low). An Income stock might be noted as a defensive pick suited for times when you want stable dividends (for example, before or during a market downturn). Having this guidance helps new investors understand the strategy for the stock at a glance – whether to buy now, wait for a certain economic phase, or hold it for steady income.
Piotroski Score (Fundamental Strength): The Piotroski F-Score is a number from 0 to 9 that rates a company’s financial health and fundamental strength. It looks at 9 criteria from the company’s financial statements (profitability, debt levels, cash flow, etc.) and gives 1 point for each positive sign. A higher score means the company’s fundamentals are solid. In the app, AMD’s score of 8 is very high – typically a score of 8 or 9 indicates a fundamentally strong value stock.
For a beginner, seeing this score is easier than analyzing dozens of financial ratios yourself. It answers the question: “Is this company financially healthy?” at a glance. If you see a low Piotroski score (say 2 or 3), that’s a warning that the company may have weak finances, whereas a high score means it passes most of the quality checks that value investors look for.
Growth Potential (DCF Model): This metric tells you how much upside the stock may have based on a Discounted Cash Flow (DCF) analysis. DCF is a common valuation method that estimates a stock’s intrinsic value by projecting its future cash flows and discounting them to present value. In simpler terms, the app calculates what the stock should be worth if it meets its expected future earnings, and then compares that to the current price. The result is shown as a percentage growth potential. For AMD, a 45.1% growth potential suggests that, according to the DCF model, the stock’s fair value could be about 45% higher than today’s price – implying AMD might be undervalued (and has room to grow).
This gives new investors a quick read on whether a stock is potentially underpriced or overpriced. A high positive percentage means the stock price could rise significantly if the company performs as expected (a possible buy signal), whereas a low or negative percentage might mean the stock is fully valued or expensive relative to its projected cash flows. Essentially, the app distills a complex valuation into a simple figure so you can gauge a stock’s upside without crunching the numbers yourself.
Dividend Yield: For income stocks (and even value stocks), dividend yield is an important number. It’s the annual dividend divided by the stock price, showing what percentage return in cash dividends you’d get each year. The app displays this so you know immediately if the stock pays a meaningful dividend. In our example, AMD’s yield is practically 0%, which is expected for a growth-oriented tech company – they reinvest profits rather than pay dividends.
But if you were looking at an income stock like a utility company, you might see a yield of 4% or 5%, indicating a solid payout. A high dividend yield can signal an income stock that provides steady cash flow (great for investors seeking income). However, beginners should also be aware that an extremely high yield could be a red flag (sometimes a result of a falling stock price) – but generally, seeing the yield helps you compare income opportunities. The app thus helps answer: “How much will this stock pay me in dividends?”and “Is this a good income-generating stock?” at a glance.
3-Month and 6-Month Returns: These figures show the stock’s recent price performance over the last 3 months and 6 months. They give you a sense of the stock’s momentum or trend. For instance, AMD’s –20% returns over 3 and 6 months tell us it has been on a downturn in the short term. This information is helpful for context: a stock that’s down recently might be a value opportunity (buy low), or it might reflect some challenges or market sentiment. Conversely, a stock with strongly positive recent returns might have upward momentum (but could also be getting pricey).
Beginners can use this to temper their expectations – if you see a stock has already run up +50% in six months, you’ll know it’s been hot lately (and perhaps due for a pullback), whereas a stock in the red might be at a bargain price or facing headwinds. While short-term performance shouldn’t be the only factor in choosing a stock, it’s a nice temperature check. The app basically spares you from looking up charts and calculating percentages; it presents the recent performance so you can easily see if the stock has been trending up or down.
By having all these insights on one screen, the Stocks 2 Buy app makes stock analysis much easier for new investors. Instead of juggling multiple websites or complex spreadsheets, you can simply search a stock in the app and see: what type it is, if it’s fundamentally strong, how much growth or value it might offer, whether it pays a good dividend, and how it’s been doing lately. This allows you to make a more informed decision in minutes.
For example, if you’re a beginner deciding between two stocks, one glance at the app might reveal that Stock A is a high Piotroski-score value stock with a 50% upside and a nice 3% dividend, while Stock B is a trendy growth stock with no dividend and a high price (maybe even overvalued). Depending on your goals, you might favor the solid undervalued choice (Stock A) or, if you have a high risk appetite, go for the growth play (Stock B). In short, the app provides an “easy stock analysis” – it crunches the data for you so you can focus on the big picture.
Putting It All Together
For new investors, learning the differences between value, growth, and income stocks is a crucial step in figuring out how to pick stocks for your portfolio. Each type has its advantages: value stocks offer bargains and safety nets, growth stocks offer high upside potential, and income stocks offer steady dividends and stability. They also each have ideal moments in the economic cycle when they tend to outperform – from recessions (favoring value and dividend stocks) to expansions (favoring growth stocks). By recognizing these patterns, you can tilt your investments toward the right mix at the right time.
The process doesn’t have to be intimidating. With tools like the Stocks 2 Buy iOS app’s Stock Type screen, even a beginner can quickly analyze a stock. The app’s use of metrics like the Piotroski score (for fundamentals) and DCF-based growth potential (for valuation) alongside clear labels for stock type and timing, helps translate Wall Street jargon into an easy, at-a-glance report. It’s like having an investing coach hand you a cheat-sheet for each stock: “This one’s a Value stock with great fundamentals – good to buy on dips and hold long term,” or “This one’s a Growth stock – exciting prospects but be mindful of market conditions,” or “This is an Income stock – expect dividends and use it for steady income especially in choppy markets.” Armed with this knowledge, you can make more confident decisions.
In conclusion, the best stocks for beginners are not a specific list of tickers, but rather those that you understand and that fit your financial goals. By focusing on the three main stock types and using easy analysis tools, you’ll be able to pick stocks for your portfolio more wisely. Remember to diversify across different types to balance risk and reward. Investing is a journey – start simple, keep learning, and let tools like these guide you along the way. With a solid grasp of value, growth, and income stocks, and insight from apps that simplify analysis, even new investors can build a portfolio poised for success. Happy investing!


Comments