
Building an Efficient Investment Portfolio with the Markowitz Model
- Sanzhi Kobzhan

- Nov 5, 2025
- 11 min read
Updated: Feb 11

Table of Contents:
Investors across the spectrum – from cautious savers to active traders – share a common goal: maximize returns while minimizing risk. Achieving this balance is the essence of an efficient investment portfolio.
In the 1950s, economist Harry Markowitz introduced a mathematical framework to help investors do exactly that. This framework, known as the Markowitz model or Modern Portfolio Theory (MPT), shows how to combine assets in proportions that offer the highest possible return for a given level of risk (or conversely, the lowest risk for a desired return).
In this article, I explain what the Markowitz model is, why constructing an efficient portfolio matters, and how to calculate optimal stock weights in theory. I’ll also walk through a simple 5-asset example and show how you can apply these ideas easily using a stock screener and portfolio builder – no heavy math required.
Understanding the Markowitz Model and Efficient Portfolios
At its core, the Markowitz model is about the risk–return tradeoff and the power of diversification. Markowitz’s key insight was that the risk of a portfolio is not just the sum of individual risks, but also depends on how the assets move in relation to each other. By combining assets that don’t move in lockstep (i.e. whose prices are not perfectly correlated), an investor can reduce overall portfolio risk without sacrificing expected return.
This is why a mix of different stocks (and other assets like bonds or ETFs) can be safer than a single stock – losses in one may be offset by gains in another. In practical terms, if two portfolios offer the same expected return, the one with lower volatility (risk) is more efficient. And if two portfolios have the same volatility, the one with higher return is preferred.
According to Markowitz’s theory, an investor should never hold a portfolio that is inefficient. If a portfolio lies below the efficient frontier (meaning another portfolio exists with higher return for the same risk), or to the right of the frontier (meaning another portfolio has less risk for the same return), then that portfolio is sub-optimal. Rational investors will gravitate towards portfolios on the efficient frontier because those represent the best achievable tradeoffs between risk and reward.
Figure: A visual example of the Efficient Frontier.

Each point on the curve represents an optimal portfolio that achieves the highest expected return for a given level of risk (standard deviation on the x-axis) or the least risk for a given return (y-axis). Portfolios that lie below the curve are inefficient (you could get more return for that level of risk), while portfolios on the frontier are optimally diversified. The curve’s shape illustrates the benefit of diversification – combining assets can reduce overall volatility.
In essence, the Markowitz model provides a systematic method to construct a portfolio that balances risk and return optimally. It requires a few key inputs: the expected return of each asset, the risk (volatility) of each asset (usually measured by the standard deviation of returns), and the covariances or correlations between assets (how their returns move together). Using these inputs, the model evaluates countless possible portfolio combinations to identify those that meet the efficiency criteria. The collection of all efficient portfolios forms the Efficient Frontier.
Why Investors Need an Efficient Portfolio
Why go through the trouble of finding an “efficient” portfolio? Because any portfolio that’s not efficient is leaving money on the table or taking on unnecessary risk. If you don’t optimize, you might end up with a portfolio that could have achieved a higher return with the same risk, or one that could have taken less risk for the same return.
For example, suppose Portfolio A and Portfolio B both target a 8% expected return. If A was constructed haphazardly and has a volatility of 12% while B (an efficient portfolio) has a volatility of only 6%, then B clearly offers a smoother ride for the same outcome. Portfolio A is taking more risk than needed – something no investor consciously wants. Markowitz’s theory ensures you don’t sacrifice returns due to poor diversification or sub-optimal asset mix.
Another reason efficiency matters is the principle of risk aversion. Most investors prefer to minimize risk if possible. The Markowitz model formalizes this by providing a clear goal: given your risk tolerance, find the portfolio that either boosts your return as much as possible for that risk, or cuts your risk as much as possible for your desired return. It helps answer questions like: “How can I earn X% a year with the least volatility?” or “If I’m willing to tolerate Y% volatility, what’s the best return I can aim for?” In other words, an efficient portfolio is tailored to your personal risk/return preferences, ensuring you’re making the most of every unit of risk you take on.
Finally, constructing an efficient portfolio enforces discipline and conscious diversification. It steers investors away from the pitfalls of putting all eggs in one basket or chasing only high-return (but highly correlated) assets. The math will naturally allocate more to assets that improve the overall risk-return profile and less to those that don’t – sometimes in ways that our instincts might not anticipate. This data-driven approach leads to more stable and predictable performance over the long run.
How to Calculate Optimal Stock Weights (Mean-Variance Optimization)
Building an efficient portfolio involves some number crunching, but the concepts can be understood step by step. Here’s how you would calculate the optimal weights of stocks in a portfolio using the Markowitz mean-variance optimization framework:
Estimate Expected Returns
First, you need an estimate of the expected return for each stock (often based on historical averages or analysts’ forecasts). For example, say we have five stocks with expected annual returns of 8%, 10%, 12%, 15%, and 18%. The portfolio’s expected return for a given set of weights is simply a weighted average of these:
E[R_p] = Σᵢ wᵢ μᵢ
where
wᵢ is the weight (fraction of the portfolio) in asset i.
μᵢ is the expected returns of the assets i.
This means if you put 50% of your money in a stock with 10% expected return and 50% in a stock with 18% expected return, your portfolio’s expected return would be 0.5×10% + 0.5×18% = 14%.
Estimate Risk (Volatility)
Next, determine the risk of each stock and how they move together. Risk is quantified by variance or standard deviation of returns. More importantly, we need the covariance matrix of returns – which tells us how each pair of stocks co-moves. If two stocks tend to rise and fall together, they have high positive covariance; if one zigges while the other zaggs, their covariance is low or even negative.
This is crucial because the portfolio’s volatility is not a simple average; it depends on these relationships. The formula for portfolio variance and volatility looks a bit complex:
σ_p² = Σᵢ Σⱼ wᵢ wⱼ Cov(Rᵢ, Rⱼ)
where
wᵢ, wⱼ - Portfolio weights for assets i and j. Typically they sum to 1 across all assets; they can be negative if short-selling is allowed.
Rᵢ, Rⱼ - Random returns of assets i and j over the chosen period (e.g., daily, monthly, yearly).
Cov(Rᵢ, Rⱼ) - Covariance between assets i and j. It measures how the two returns move together. low or negative covariance reduces total portfolio risk.
And a volatility (standard deviation) is a square root of variance
σ_p = √(σ_p²)
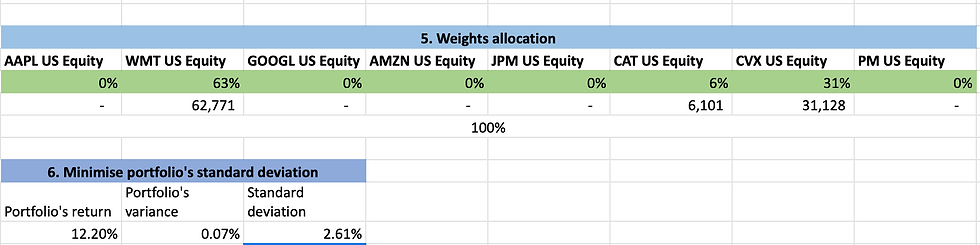
Below is an example of the Variance-Covariance Matrix for the 8-asset portfolio calculated in Excel. For the Excel efficient portfolio building guide, read my article "Build an efficient investment portfolio and minimize its losses”.
Example: Variance-Covariance Matrix for the 8 asset portfolio

In simpler terms, you calculate how much risk comes from each individual stock (the first term, summing up each weight squared times that stock’s own variance), plus the pairwise interactions (the second term involving covariances). If two stocks have low or negative covariance, they contribute less to overall volatility – which is the mathematical expression of diversification.
Optimize the Weights
With expected returns for each stock and the covariance matrix in hand, we set up an optimization problem. Typically, it goes like this: for a chosen target return, find the set of weights that achieves that return with minimum possible variance.
Alternatively, you can flip it: for a maximum acceptable risk level, find weights that give the highest return. This is a constrained optimization (a quadratic programming problem) that can be solved with calculus or Excel's Solver tool. The result will be the optimal weight vector – essentially how much capital to allocate to each stock.
These weights sum up to 100% of the portfolio (and if short selling is allowed, some weights could be negative, indicating a short position). The math ensures that this particular combination is on the efficient frontier – there is no portfolio with a better risk-return mix for your given constraint.
Example: Efficient portfolio in Excel using the Solver tool
To illustrate, imagine optimizing a portfolio of five stocks A, B, C, D, and E. The process will consider options like “maybe 30% A, 20% B, 0% C, 25% D, 25% E” versus “10% A, 30% B, 20% C, 30% D, 10% E,” and so on – essentially scanning the universe of possible allocations.
It finds the allocation where the expected portfolio return equals your target (say 10% annually) and the volatility is as low as it can possibly be for that target. Any slight tweak to those weights would either drop the return below 10% or raise the risk above the minimum. This optimal mix is your efficient portfolio for the 10% return level.
Example: A 5-Stock Efficient Portfolio Calculation
Let’s make this concrete with a simplified example. Suppose you select five stocks from different sectors: Apple, Amazon, Microsoft, Goldman Sachs, and Pfizer. Based on historical data, assume their expected returns are around 12% for Apple, 15% for Amazon, 10% for Microsoft, 8% for Goldman, and 7% for Pfizer, with various volatilities.
Now, say you want to aim for a 10% expected return on the portfolio. If you feed these inputs into a Markowitz optimization solver, it might come back with a recommendation like this: put roughly 50% of your funds in Pfizer (the stock with the lowest volatility), about 16% in Microsoft, 24% in Apple, 8% in Amazon, and only ~3% in Goldman Sachs. Why such uneven weights? The model recognized that to achieve 10% return with minimal risk, it should heavily weight the more stable, lower-risk asset (Pfizer) and give a very small allocation to the higher-risk asset (Goldman) – even though Goldman’s expected return was lowest, its presence (in a tiny amount) still helped reach the target return while its high volatility could hurt the portfolio if over-weighted.
The resulting portfolio in this scenario has an overall volatility of around 5.6% (standard deviation). That is significantly lower than the volatility of many individual stocks in the mix, demonstrating how diversification and optimal weighting reduce risk. Any other combination of these five stocks that still targets 10% return would mathematically end up with higher than 5.6% risk – which is why this particular allocation is considered “efficient.”
Of course, in practice you would use more than five stocks and you’d use a computer to perform these calculations. The takeaway is that the Markowitz model provides a clear formula for the best possible portfolio given your goals.
It might allocate in ways you wouldn’t have guessed (maybe investing more in a boring stable stock and less in a flashy high-growth stock if that’s what minimizes risk). This quantitative approach guards against emotional or purely speculative decisions, anchoring your strategy in sound financial theory.
Automating the Process: Build an Efficient Portfolio with a Stock Screener & Portfolio Builder
Calculating an efficient portfolio by hand can be tedious – especially as you include more assets. The good news is that modern tools can do the heavy lifting for you. If number-crunching isn’t your forte, you can use my Stock Screener and Portfolio Builder app to construct an efficient portfolio in just a few clicks.
This tool is designed to integrate the steps of finding suitable stocks and optimizing their weights using the Markowitz model.
How it works
You start by inputting your risk appetite and target return. For instance, you might indicate “I prefer low-risk stocks” or “I’m okay with high-risk, high-reward stocks”. The screener then filters the stock universe to show you companies that fit your risk profile – e.g. low-risk mode will emphasize stable, large-cap stocks with lower volatility (low beta, high liquidity), whereas high-risk mode will surface more volatile growth stocks (higher beta, still with solid fundamentals and liquidity).
You can also set a desired annual return (say 20% or 35%) using a simple slider. Once you have a shortlist of promising stocks, you select a handful (at least five for good diversification) and hit “Build Portfolio.”
At that point, the Portfolio Builder kicks in and performs the Markowitz optimization behind the scenes. It automatically pulls historical price data for your chosen stocks (about one year’s worth) and calculates each stock’s average return and volatility, as well as the correlations between stocks (using the Variance - Covariance Matrix).
Then, using the Nobel Prize-winning Markowitz model, it computes the optimal weight for each stock in order to achieve the target return you set with the lowest possible risk. In other words, the tool finds the exact efficient portfolio on the frontier corresponding to your goal. This all happens in seconds – the result is presented to you as an allocation list (e.g. Stock A: 30%, Stock B: 25%, Stock C: 20%, etc.), along with the expected portfolio return and its minimized risk (standard deviation) for transparency.
The outcome is a fully customized, efficient portfolio tailored to your risk tolerance and return objective. You avoided all the manual calculations, yet you benefit from a rigorous optimization. In short, my stock screener & portfolio builder lets you find great stocks that match your risk appetite and then effortlessly allocates them into an optimal portfolio – all in one integrated workflow.
Personal tip: For a step-by-step instruction on using the app, read my article "Find Great Stocks and Build an Efficient Portfolio with My Stock Screener and Portfolio Builder”.
I invite investors and traders of all experience levels to give this web tool a try and see how it can help you build a diversified, efficient portfolio aligned with your goals. By leveraging advanced financial theory in a user-friendly app, you can invest with greater confidence, knowing that your portfolio is quantitatively designed to maximize returns for the level of risk you are willing to take.
The Markowitz model in 50 minutes
I've made a lecture series using NotebookLM AI and this article material to explain what the Markowitz model is and why investors should use it. Enjoy.
Lecture 1:
Lecture 2:
Lecture 3:
Lecture 4:
Lecture 5:
Lecture 6:
Lecture 7:
Lecture 8:
Lecture 9:
Lecture 10:
FAQ — Markowitz Model, Efficient Frontier & Portfolio Optimization
What is the Markowitz model in investing?
The Markowitz model, also known as Modern Portfolio Theory (MPT), is a framework for building portfolios that minimize portfolio's loss for a given level of expected return. It uses diversification and correlations between assets to improve the risk–return tradeoff.
What is an efficient portfolio and why does it matter?
An efficient portfolio sits on the efficient frontier, meaning no other portfolio offers higher expected return at the same risk (or lower risk at the same return). Investors use efficient portfolios to avoid unnecessary volatility and improve long-term consistency.
What is the efficient frontier in Modern Portfolio Theory?
The efficient frontier is a set of optimal portfolios that provide the best possible expected return for each risk level. Portfolios below the frontier are considered inefficient because better risk-adjusted options exist.
How are optimal portfolio weights calculated in mean-variance optimization?
Mean-variance optimization calculates weights using expected returns, asset volatility, and the covariance (correlation) between assets. The model selects allocations that minimize portfolio variance for a target return or maximize return for a given risk constraint.
How many stocks do you need for Markowitz portfolio optimization?
Most investors need at least 5 stocks for meaningful diversification and optimization results. A larger set of assets can improve diversification, but correlations matter more than simply adding more tickers.
Should investors allow short selling in a Markowitz portfolio?
Allowing short selling can help reduce risk and improve portfolio efficiency, but it adds complexity and may not suit all investors. Many individuals prefer long-only portfolios for simplicity, lower leverage risk, and easier implementation.


Comments