
The “Price-Tag Bias” Trap: Why “Undervalued Stocks Under $X” Screens Lie
- Sanzhi Kobzhan

- Dec 22, 2025
- 4 min read
Updated: Feb 10

Many investors fall for the “cheap share” myth, assuming that a low nominal share price automatically means value. In reality, a stock’s price alone tells us nothing about its valuation.
Stock splits perfectly illustrate this: after a split, the share price drops but total market capitalization stays the same. For example, a one-for-ten split would turn a $100 share into ten $10 shares, but the company’s value remains constant. This price-tag bias can mislead retail screens looking for “undervalued stocks under $5/$10” – they may simply be flagging small firms that happen to trade cheap.
This bias can lure investors into false bargains. Instead, focus on market cap and fundamentals. A large-cap company with a $200 share price could still be cheaper than a $5 stock if it has far fewer shares outstanding. In short, never confuse a lower price tag with intrinsic value – always consider the company’s size and underlying business first.
What to Screen Instead: Market Cap, Value Ratios, and Fundamentals
Rather than filtering by share price, start by grouping stocks by market capitalization. Compare companies within the same cap band (small-, mid- or large-cap) so you’re examining similarly sized businesses.

Within each band, screen by traditional value ratios and fundamentals. Key value metrics include the price/earnings and price/book ratios. The P/E ratio compares a stock’s price to its earnings per share, and the P/B ratio compares market price to book value. Look for stocks that have unusually low P/E or P/B relative to peers – but only as a first filter.
Of course, valuation multiples alone aren’t enough. Always cross-check a company’s financial health and trajectory. Look for steady EPS and revenue growth, expanding profit margins, and robust free cash flow.
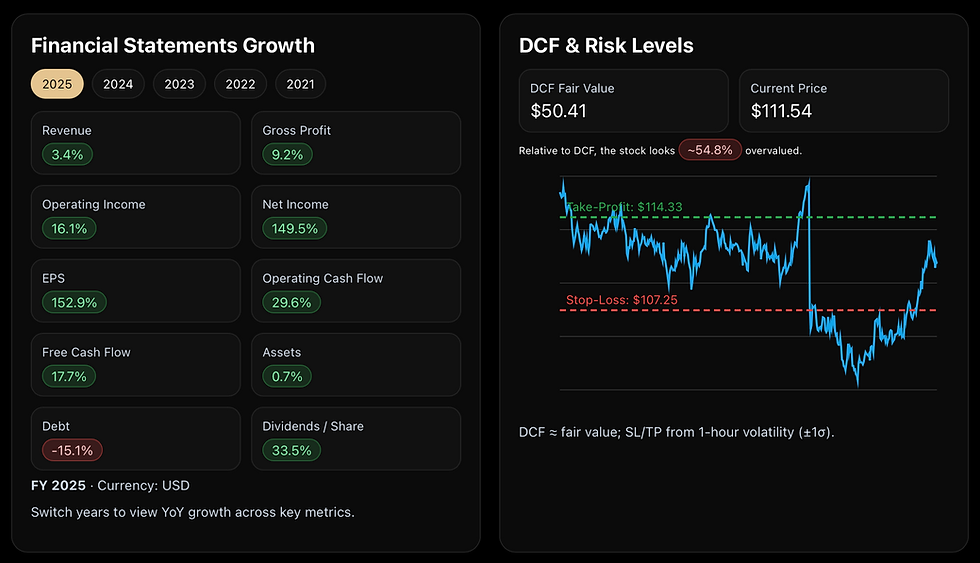
Companies with deteriorating fundamentals (falling earnings, shrinking margins or mounting debt) may only look cheap because the market expects trouble.
In fact, research shows that firms with strong multi-quarter improvements in fundamentals (rising EPS, ROE, margins) tend to outperform the rest. In short, a truly undervalued stock should be fundamentally sound – otherwise the low price might reflect underlying problems.
A “Split-Proof Undervaluation Checklist”
Filter by Market Cap
Define the market-cap range (small, mid, large) before looking at prices. This avoids mismatched comparisons (e.g. a tiny $5 stock vs. a mega-cap $100 stock). Focus on one cap band at a time.
Screen Value Ratios
Look for low multiples within each band. For example, target stocks with lower P/E or P/B than industry peers. A genuinely cheap stock will trade at a discount on these ratios and have competitive earnings or assets behind it.

Inspect Fundamentals and Growth
Verify that recent financial trends are strong. Check for consistent EPS and revenue increases, healthy operating margins and return on equity. In other words, prefer candidates demonstrating fundamental momentum, not just a low stock price.

Compare to Peers
Rank the remaining candidates against direct competitors. A good value pick should not only have lower valuation ratios but also equal or superior growth and profitability metrics. If its peers are stronger or much cheaper, reconsider the pick.

Perform a Sanity Check
Run a quick DCF or look at consensus target prices. Use a sensitivity analysis: even a small tweak in the discount rate or long-term growth rate can swing a DCF valuation dramatically.

Also inspect analyst target dispersion: a wide range of price targets signals uncertainty, meaning the apparent “value” may be a red flag.

Debt and Corporate Health
Finally, ensure nothing sinister is hiding. Check if the debt-to-equity ratio is far above peers, or if cash flows are deteriorating. One-time charges, accounting quirks or governance issues can justify a low price. A true value buy should pass these checks unscathed.
The “Price-Tag Bias” Trap
By following this checklist, you’ll filter out companies that only look cheap based on share price and focus on those that are cheap for good reasons. Find stocks that are truly undervalued and fundamentally solid, rather than falling into the price-tag trap.
FAQ — Stock Price vs Value Investing Fundamentals
Does a low stock price mean a stock is undervalued?
No, a low share price alone doesn’t indicate value. Investors should focus on market capitalization, financial health, and valuation ratios rather than assuming cheaper-priced stocks offer better investment opportunities.
How do stock splits affect valuation?
Stock splits reduce the share price but increase the number of shares proportionally, leaving the company’s market value unchanged. They improve liquidity but don’t make a stock cheaper or more fundamentally attractive.
What metrics are better than share price for finding undervalued stocks?
Common valuation tools include price-to-earnings (P/E), price-to-book (P/B), free cash flow yield, and enterprise value ratios. These metrics help investors assess value relative to earnings, assets, and cash generation.
Why is market capitalization important in stock analysis?
Market cap reflects the company’s total market value and helps compare businesses of similar size. Evaluating stocks within the same cap category avoids misleading comparisons between small-caps and large-caps.
Can a high-priced stock still be undervalued?
Yes, a company with strong earnings, cash flow, and growth prospects can trade at a high share price yet still offer attractive value. Price per share alone doesn’t determine valuation or investment quality.
What are the biggest mistakes investors make when screening cheap stocks?
Many focus only on low share price without checking fundamentals like earnings growth, debt levels, or profitability. This “price-tag bias” can lead to value traps rather than genuine undervalued opportunities.


Comments